GPS Approach App
GPS based CDI, HSI and 2x2D Visualization for ILS and self defined Approaches
GPS based CDI, HSI and 2x2D Visualization for ILS and self defined Approaches
GPS data accuracy is limited due to the device capabilities!
Any liability of the developper is excluded!
Toggle between the visualizations by tapping the top area of the HSI, CDI or 2x2D view.
Typical "Glas" HSI

This is a typical "Glas"-Type HSI
The HSI Page displays a rotating compass card in a heading-up orientation.
Letters indicate the cardinal points and numeric labels occur every 30°. Major tick marks are at 10° intervals and
minor tick marks at 5° intervals.
The HSI also presents course deviation
(in Approach Mode 1° per Dot and Full scale deflection is 2.5°)
The following information is presented as Text:
Distance to Waypoint (Threshold)
GPS Groundspeed
Course of the course line
GPS Altitude
Target Vertical Speed (to follow Glide Path)
Vertical Deviation (Glideslope) Indicator
The Vertical Deviation (Glideslope) Indicator appears to the right of the compass rose. A magenta diamond acts as the VDI, like a glideslope needle on a conventional indicator. Glidepath Deviation is shown as 0.28° per dot and Full scale deflection is 0.7°
Typical old fashion CDI

This is a typical analogue-Type CDI
The CDI Page displays a rotating compass card in a course-up orientation.
The two needles show the lateral and glideslope deviation angle.
The lateral deflection is shown in Approach Mode as 0.5° per Dot and Full scale deflection is 2.5°
The Vertical Deviation (Glideslope) deflection is shown as 0.14° per dot and Full scale deflection is 0.7°
The 2x2D is a special Visualization
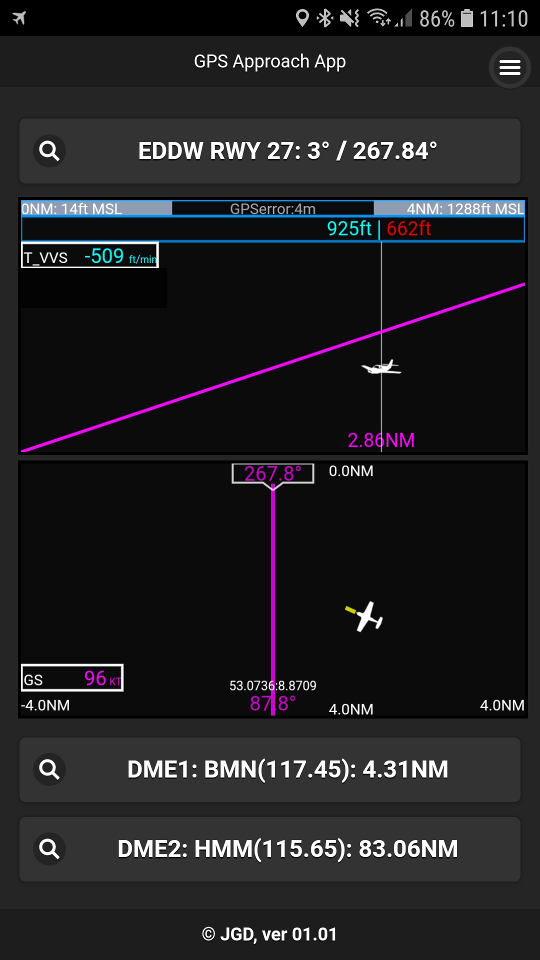
This is special visualization, very helpful and with a lot of features
Top 2D View: Vertical Deviation (Glideslope) Visualization
This displays a side view, where you see the target Glideslope and the aircraft in relation to it.
The horizontal scale is depending on the zoom mode (automatic or fixed distance to threshold).
In the top bar you see on the left side the threshold of the approach (0NM) and the threshold altitude in ft.
On the right side you see the actual scale in NM and altitude of the Glideslope at this distance.
A light blue bar visualizes the actual scale (4NM: long bar, 11NM mid bar, 20NM small bar).
Below the aircraft at the bottom you see the actual distance of the aircraft to the threshold (moving with the aircraft).
Above the aircraft in the second top bar you see a moving indication of the target altitude, which the aircraft should have, if it were on the Glideslope (cyan)
and the actual altitude (in green near the target altitude, otherwise in some red colors ).
On the left side the following information is presented as Text:
Bottom 2D View: Horizontal Deviation (Localizer) Visualization
This displays a top view, where you see the target approach course and the aircraft in relation to it.
On the top you see the approach course and the actual offset of this 2D view
On the bottom you see the counter approach course and the scale distance to the threshold
This top view have to modes (you can toggle between them by tapping this top view area):
If scale permits in front of the Aircraft a Turn Guidance Line (yellow) is depicted. The end of the line indicates where the aircraft would reach the final approach course if a standard rate turn with the actual ground speed would be executed now. So, if you want to perfectly align with the final course, just start your turn, when the yellow line reaches the magenta course line.
On the left side the following information is presented as Text:Load Approaches and DMEs
Generate Approaches